Despite supply-chain problems amid the lingering effects of the pandemic, 2022 saw major increases in solar and wind power in the United States, though that growth varied by state, according to a report released last month by a nonprofit focused on climate change.
Minnesota top 10 in wind
Nationally, electricity generated from solar and wind grew 16% from 2021, with wind accounting for about 74% of that, per Climate Central’s ”WeatherPower Year in Review: 2022” report.
The New Jersey-based group analyzed data from its WeatherPower tool, which combines data on installed solar and wind facilities with observed and forecast weather information to create predictions of daily wind and solar generation by state, county, media market or congressional district in the lower 48 states. Alaska and Hawaii were not included because of data limitations, the report says. (However, Yale’s Climate Connections broke down 2021 numbers on where electricity generated in all 50 states comes from).
President Joe Biden’s administration has set a goal of a 100% clean electric grid by 2035 and net zero carbon emissions for the entire U.S. economy by 2050. As of November, 36 states and the District of Columbia have established a renewable energy goal or a renewable portfolio standard, which generally requires electric suppliers to provide customers a minimum share of electricity from renewable sources..
“We wanted to help people understand how much renewable energy is being used, how it has grown and how much more it needs to grow in order to help meet climate goals,” said Jen Brady, manager of analysis and production for Climate Central. “In particular we discussed the climate goal of reaching net-zero emissions in the U.S.”
If historic trends continue, Brady said, the U.S. will fall short of those goals, though taking into account data from the Federal Energy Regulatory Commission on approved renewable projects, “we are seeing an increase in renewables that could lead us to satisfying net-zero goals.”
The electric power sector accounts for about a third of U.S. carbon emissions, which makes decarbonizing power production key to mitigating the effects of climate change. Though U.S. energy-related carbon emissions increased in 2021 by about 6% over 2020, that followed “a rise in economic activity and energy consumption once the initial economic impacts of the COVID-19 pandemic began to subside,” according to the U.S. EIA. Despite the increase, 2021 emissions were still lower than 2019 by about 5%, and 19% lower than the 2007 historical peak, the EIA said.
Solar and wind are expected to together account for 16% of total U.S. electric power generation in 2023, up from 14% in 2022, according to the U.S. Energy Information Administration. All told, the Climate Central report says, the 683,130 gigawatt hours generated across the country from wind and solar were enough to power 64 million average American households, defined as a residential customer who uses about 886 kilowatt hours per month.
But there can be big differences as far as what’s being built in individual states. And to understand the Climate Central findings, it’s crucial to know two different electric industry terms: capacity and generation. Capacity, measured in megawatts, is a measure of the maximum output of a given electric generation plant under optimal conditions, like strong winds or full sun. Generation, measured in megawatt hours, is how much electricity is actually produced.
Texas led the nation in both wind capacity (nearly 37,400 megawatts) as well as actual generation (nearly 130 million megawatt hours). California led the nation in installed solar capacity (about 28,500 megawatts) and solar generation (nearly 59 million megawatt hours). Texas was also second place in both categories in solar, though Florida, North Carolina and Arizona were also in the top five for solar generation. In wind capacity and generation, Iowa and Oklahoma followed Texas.
In a different analysis, the American Clean Power Association, an industry group, said 18 states installed more wind, solar or battery storage in 2022 than in 2021. Six states that installed no new capacity in 2021 — Delaware, Idaho, Kentucky, Louisiana, New Hampshire and Tennessee — installed new capacity in 2022, the group said, noting that Mississippi, Washington and Hawaii saw the highest growth in annual installations from 2021 to 2022. The association said the top states for renewable projects in development are, from biggest to smallest, Texas, California, New York, Indiana, Virginia, Arizona, Illinois, Nevada, Ohio and New Jersey.
“Certain locations are more suitable to certain types of renewable energy,” said Brady. “With the exception of offshore wind, which may increase wind power in smaller states along the East Coast, it is reasonable to expect places with more open land (and more wind) to install more wind turbines. Solar is a bit more universal, but locations still may weigh its suitability versus using more wind power, for example.”

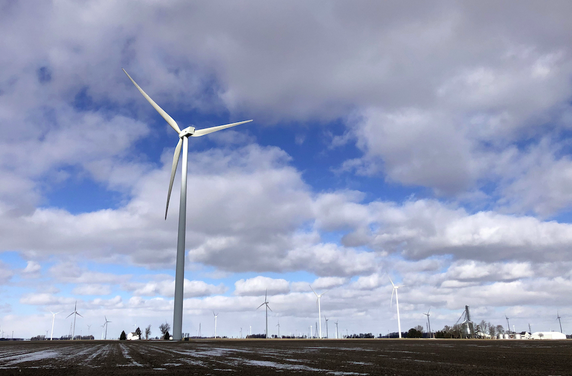
Solar and wind are expected to together account for 16% of total U.S. electric power generation in 2023, according to the U.S. Energy Information Administration. Photo by Robert Zullo/ States Newsroom.
To achieve 100% clean energy by 2035, solar and wind need to provide 60% to 80% of U.S. electric generation, according to a least-cost scenario modeled by the National Renewable Energy Laboratory. Big transmission upgrades are also required, mostly to bring electricity from wind-rich but sparsely populated areas to big urban and suburban areas with large electric demand.
“To achieve those levels would require rapid and sustained growth in installations of solar and wind generation capacity,” the report says.
In 2022, wind provided a little more than 10% of U.S. electricity, while solar supplied 3.4%, per the EIA.
Top 10 states for wind and solar capacity in 2022
*Does not include Alaska or Hawaii
Solar
1. California 28,493 megawatts
2. Texas 12,702 megawatts
3. Florida 7,170 megawatts
4. North Carolina 6,242 megawatts
5. Arizona 4,841 megawatts
6. Nevada 4,210 megawatts
7. Georgia 3,323 megawatts
8. Virginia 3,260 megawatts
9. New Jersey 2,954 megawatts
10. Massachusetts 2,731 megawatts
Wind
1. Texas 37,365 megawatts
2. Iowa 12,259 megawatts
3. Oklahoma 11,715 megawatts
4. Kansas 8,261 megawatts
5. Illinois 7,057 megawatts
6. California 6,269 megawatts
7. Colorado 5,177 megawatts
8. Minnesota 4,710 megawatts
9. New Mexico 4,410 megawatts
10. North Dakota 4,333 megawatts
Source: Climate Central, “WeatherPower Year in Review: 2022”